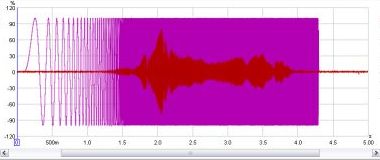
This graph is available for the LAST generated sweep test signal and the uncorrected system
response acquired via the interface. This may be useful for troubleshooting.
This is not a live display. Content updates after a sweep is complete.
Only the signals for the last measurement are shown. It is not available on measurements loaded from disk.
The Y axis is the percentage of digital full scale. If the captured trace reaches ±100%, it is clipping [distorted]
and the sweep level, AV processor volume or input volume should be reduced.

A check box is provided to invert the captured trace for easier comparison with the test signal if the soundcard input is inverting. As a more permanent solution for this select the Invert checkbox in the soundcard Input Channel settings.
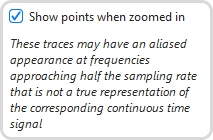
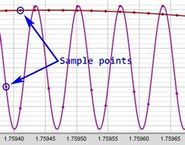
Show points when zoomed in shows the individual time samples if the horizontal zoom level is high enough to distinguish them.