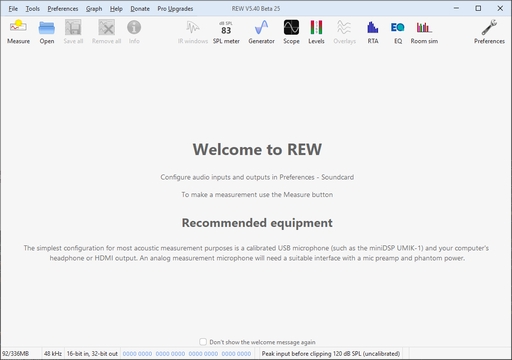
When REW is started it looks like this:
The main window is blank until we either make a measurement or load some
existing measurements. The SPL Meter, Signal Generator, Scope and Level Meters
can be used without loading any measurements,
as can the RTA window, EQ window and the Room Simulator,
After making or loading some measurements the main window looks like this:
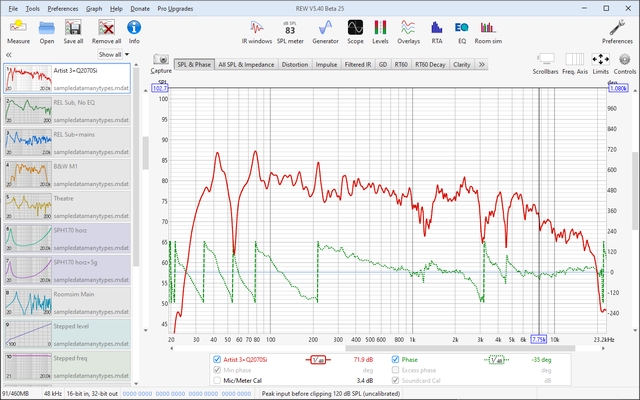
The measurements appear in panels on the left. The currently selected measurement has a white background, the others are dimmed. Some have tinted backgrounds to distinguish different types of measurement. On the right is the graph area for the current measurement.
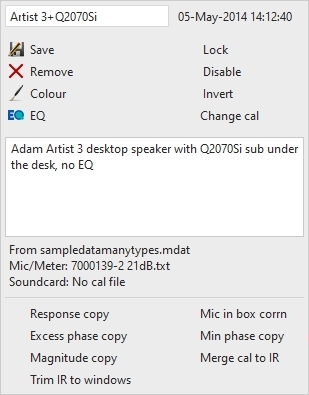
Right clicking on a measurement brings up a menu of actions and displays additional information about the measurement, including any notes made.
All the toolbar buttons are now enabled. They are
in 3 groups, firstly the buttons related to measurements:
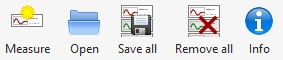
These buttons allow a new measurement to be made, existing measurement files
to be opened, all the current measurements to be saved in a single measurement
(.mdat) file, all the current measurements to be removed, and an Info panel to
be opened that shows additional information about the current measurement.
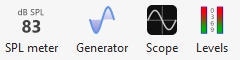
The next group has the various tools
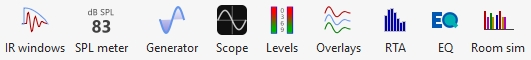
The IR Windows button opens a window that allows the type and extent of the
Impulse Response windows for the current measurement to be changed. Next to
that are the SPL Meter, Signal Generator, Scope and Level Meters buttons. Then there
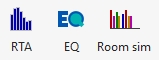
is a button to open the Overlays graph window, which allows any or all of the
loaded measurements to be plotted on the same graph. The last three buttons are
for the RTA window, the EQ window (which is used to study the effects
of EQ on the current measurement) and the Room Simulator.
The final toolbar button brings up the Preferences panel

In the graph area there is a button to capture the current graph as an image
![]()
a selector strip to pick the graph type

and buttons to turn scrollbars for the graph area on/off, toggle the frequency
axis between log and linear, set the graph limits and show the graph controls
menu.
![]()
Below the graph is a legend area that shows the trace values at the cursor position
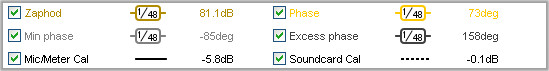
If smoothing has been applied the octave fraction (1/48 in the image above) appears
between the trace name and its value. Right clicking in the legend area brings up a menu
of options to help manage trace selections.
The first step in getting REW running is to set up the audio input and output and calibrate the soundcard.