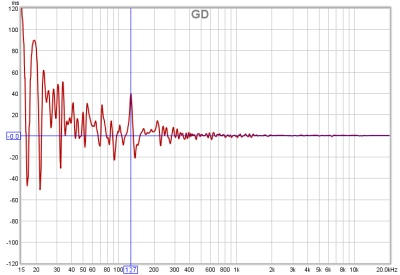
The group delay for the measurement is calculated from the slope of the phase trace. Note that if smoothing has been applied to the measurement that will also smooth the phase and group delay traces. Smoothing can be applied or removed via the Graph menu and its shortcut keys. Peaks and dips in the frequency response will usually be accompanied by corresponding peaks and dips in the group delay. The group delay will include any delay in the measurement due to time delays in the PC or soundcard, processing delays in the equipment and delays due to the time sound takes to travel from source to microphone. Delays in the PC or soundcard can be eliminated by using the Use loopback as timing reference or Use acoustic timing referenceoptions in the Analysis Preferences. If the group delay is tending towards a level at the upper end of the measurement that level typically corresponds to the overall measurement delay.
The control panel for the Group Delay graph has these controls:
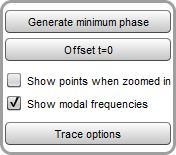
Generate Minimum Phase will produce a minimum phase version of the measurement using the current IR window settings. This activates minimum and excess group delay traces that show how the measurement's group delay compares with the response of a system having the same frequency response but with the lowest phase shift such a system could have. Note that it is best to make full range measurements if the minimum phase response is to be generated as a good result relies on measuring beyond the bandwidth of the system being measured. This control also activates minimum and excess phase and minimum phase impulse traces on the SPL & Phase and Impulse graphs respectively.
Note that the IR window settings are important as the minimum phase response is derived from the frequency (magnitude) response of the measurement, which in turn is affected by the IR window settings. If the window settings are subsequently changed Generate Minimum Phase should be used again to reflect the new settings. Note also that the shape of the left side window (the window applied before the peak) affects the minimum phase result, a rectangular window will produce a response with lower phase shift than, for example, a Hann window.
If the system being measured was inherently minimum phase (as most crossovers are, for example) the minimum phase response is the same as removing any time delay from the measurement. Room measurements are typically not minimum phase except in some regions, mainly at low frequencies. For more about minimum and excess phase and group delay see Minimum Phase.
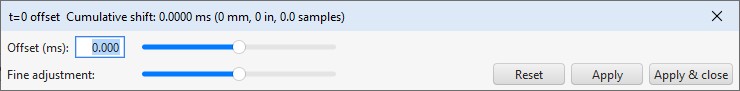
Offset t=0 allows the position of time zero in the impulse response to be altered, with a live preview of the effect the offset will have on group delay and phase. The measurement is not changed unless either the Apply or Apply & close button is pressed. There are two sliders for offset adjustment, one for coarse adjustment and one for fine to provide a wide adjustment range. Fine adjustment of either slider can be made with the left and right arrow keys after clicking on the slider knob. The sliders can also be adjusted with the mouse scroll wheel, holding the Alt key provides fine adjustment in that case. If a timing reference was used the System Delay figure (which can be viewed in the measurement Info panel) is shifted by the same amount as the zero time. The cumulative shift that has been applied to the impulse response is shown at the top of the dialog.
If Show points when zoomed in is selected the individual points that make up the measured and minimum phase responses are shown on the graph when the zoom level is high enough for them to be distinguished (which may only be over part of the plot)
If Show modal frequencies is selected the theoretical modal frequencies for the room dimensions entered in the Modal Analysis section of the EQ Window are plotted at the bottom of the graph.
The Trace options button brings up a dialog that allows the colour and line type of the graph traces to be changed. If a change is made it will be used for all measurements shown on this graph. Traces can also be hidden, which will remove them from the graph and from the graph legend.