The Room Simulator generates frequency responses for multiple sources at multiple locations in a rectangular room. It uses a frequency domain method based on the rigid boundary solution to the wave equation, modified for lossy boundaries. Results are equivalent to those obtained by the image source method in the time domain (Allen and Berkley 1978). Sources and listening positions can be altered by dragging on plan and elevation views of the room.
The maximum mode order in each axis is 20. If the room has any very large dimensions the end frequency of the simulation will be limited to correspond to the mode order.
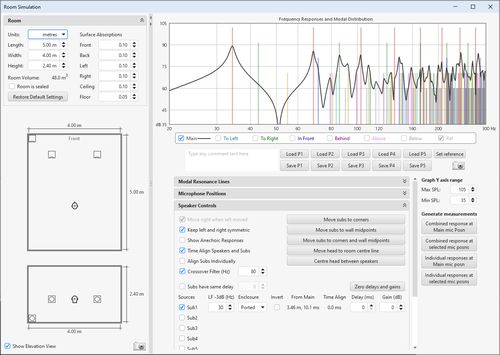
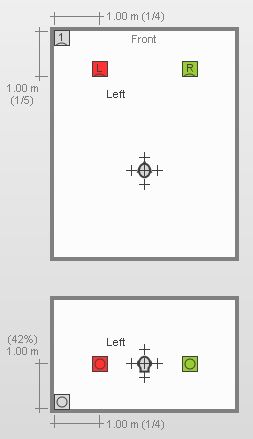
The Room Simulator window looks like this when first opened:
The left hand panel shows a view of the room with controls for room dimensions and the acoustic absorptions of the room's surfaces. The right hand side shows the frequency response at the main listening position and additional positions around it and has controls for which modal resonances are shown, the positions at which responses are to be calculated, the sources to be modelled and and how they are managed. The entire window can be resized and the divider between the left and right panels can be dragged to adjust the proportion allocated to each. The small triangles at the top of the divider allow either panel to be collapsed completely.
The dimensions and properties of the room are configured in the controls
at the top of the room panel. The controls may be collapsed by clicking on
the chevrons at the top right of the panel.
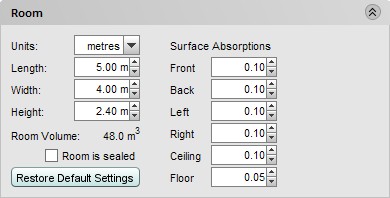
Dimensions may be displayed in metric or imperial units according to the selected Units. Regardless of the units selected, the dimension controls accept input in metric or imperial units, for example 2.5m, 250cm, 2500mm, 8.2ft, 8ft 2in, 8' 2", 8f2i, 8f2 and 98in are all valid entries. If an entry is a number without any units it is assumed to be in the selected measurement units.
If the room is well sealed select the Room is Sealed box, this increases the response boost at the lowest frequencies.
The surface absorptions define how sound is absorbed when it meets the surface. The absorptions are independent of angle or frequency. The higher the absorption figures, the more sound is absorbed at that surface and the more damped the room's modal resonances become.
Below the room panel controls are the views of the room, in plan and elevation.
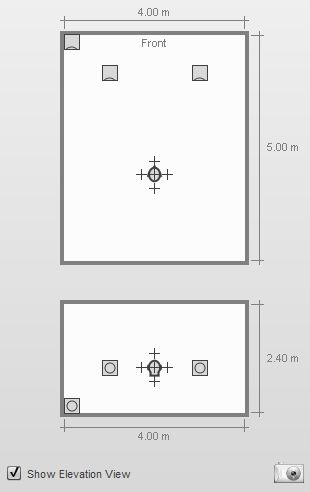
The main listening position is indicated by the head. Crosses around the head show the locations of any additional points selected for responses to be generated, in the image above the positions to left, right, in front, behind, above and below the main listening position have been selected. The elevation view can be hidden by un-ticking the Show Elevation View box at the bottom of the panel. An image of the room panel can be captured by clicking on the camera icon in the bottom right corner.
A source can be selected by moving the mouse cursor over it. The source
will be highlighted and can be moved by left-clicking and dragging or by
using the arrow keys, the arrow keys allow finer adjustment of position. If the
shift key is held down while dragging, movement will be restricted to either
horizontal or vertical only. Source outlines may overlap the room boundaries
at large room sizes, the location of the acoustic centre is not affected.
The source can be rotated by right-clicking or by pressing the R key (clockwise
rotation) or L key (anticlockwise rotation). Note that rotating the source does
not alter its response, all sources are treated as omnidirectional. The main
listening position can similarly be moved using the mouse or, after highlighting
it, the arrow keys, as can any of the additional listening positions. When a
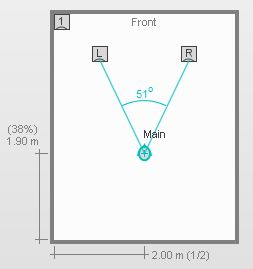
source or listening position is highlighted its location is shown:
When a source is highlighted the dimensions shown are to the acoustic centre, which is located at the centre of the front face. Highlighting a source also shows its individual contribution to the combined response at the main listening position on the response graph.
Highlighting the head position when the simulation includes left and right
speakers will show the angle between them at the head position.
The frequency response at the main listening position and additional positions
around it are shown on the response panel. An additional "Ref" trace can be set
to retain the current main position response and act as a reference as changes are
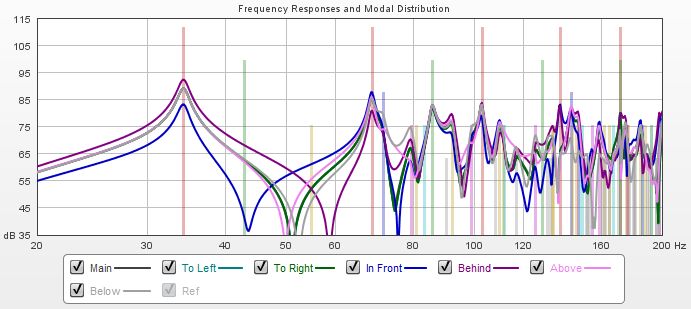
made. The modal distribution for the room is shown on the response panel using lines
that are colour-coded according to the axes they include:
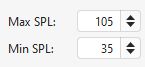
The range of the response plot can be changed using the min and max SPL controls below the graph.
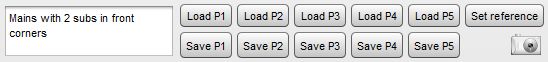
Five sets of room simulator configurations can be saved to and loaded from presets using the buttons below the graph legend. Each preset contains the room dimensions and absorption values, the source selections and positions and mic selections and positions. Presets are remembered for the next startup. Any comment entered is saved with the preset. To the right of the preset buttons are a button to set the reference trace to the current Main position response and a button to capture an image of the response graph, which includes any comment entered.
The Modal Resonance Lines controls identify the colours of the
individual lines and allow their transparency to be adjusted. Any lines which
are not selected will not appear on the graph.
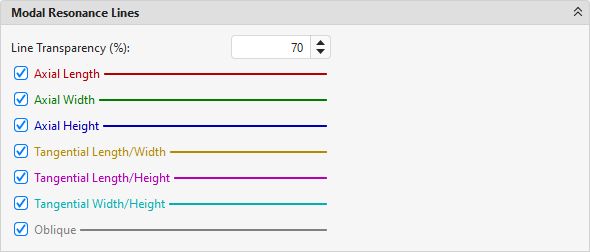
| Colour | Mode |
|---|---|
| Red | Axial Length |
| Green | Axial Width |
| Blue | Axial Height |
| Orange | Tangential Length, Width |
| Magenta | Tangential Length, Height |
| Cyan | Tangential Width, Height |
| Grey | Oblique |
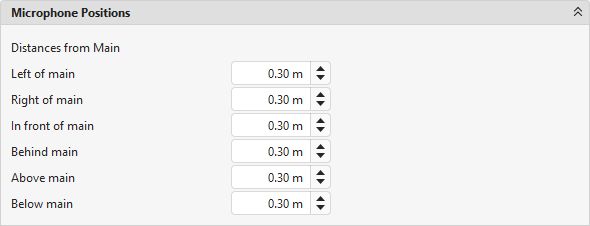
The Microphone Positions controls set the distances for the additional
listening positions from the main position. They can also be adjusted by dragging
the crosses on the room view.
Speaker Controls allow a number of sources to be selected,
including up to 8 subwoofers. If Subs have same delay is selected
all the subs use the delay figure next to the check box, otherwise each sub
uses its own delay setting. The low frequency extension of each source
can be configured independently - this is the frequency at which the source
begins to roll off, it is not the bass management frequency, which is set
using the Crossover Filter control. The room responses
shown are the sums of the contributions of all the selected sources.
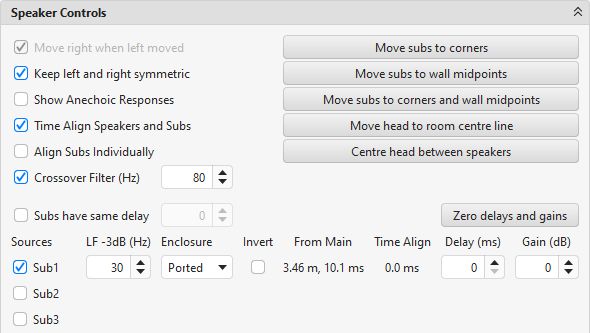
Subwoofers can be relocated to the corners or wall midpoints by pressing the appropriate buttons, the head can be moved to be centred across the width of the room or centred between the speakers.
If Move right when left moved is selected moving the left speaker will also move the right speaker, keeping the same distance between the speakers. The right speaker can be moved independently. If Keep left and right symmetric is selected moving either speaker will move the other, keeping them at the same height and distance from the front wall and equal distances from the side walls.
If Show Anechoic Responses is selected the response plots remove the room contributions, leaving only the responses of the sources themselves. Sources can be time aligned at the main listening position and, if multiple subs are being simulated, the effect of time aligning each sub individually can be observed (note that if a symmetric placement of multiple subs is being used to minimise modal excitation the subs should not be individually aligned). The distances and times of flight to each source are shown and the effect of adding a time delay or gain adjustment to each source can be observed by altering the relevant controls.
Note that the simulation automatically level aligns sources to the main listening position, but that all the simulated subwoofers generate signals at the same level - this is necessary if they are arranged symmetrically to minimise modal excitation and reduce seat-to-seat variation.
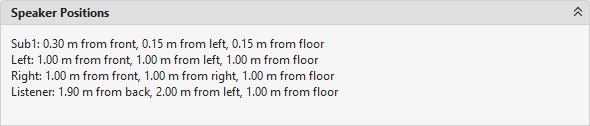
Speaker Positions pane shows a list of the locations of all the sources in the room.
On the right side of the panel there are buttons to generate measurements from
the simulated responses.
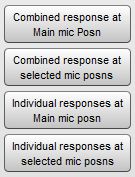
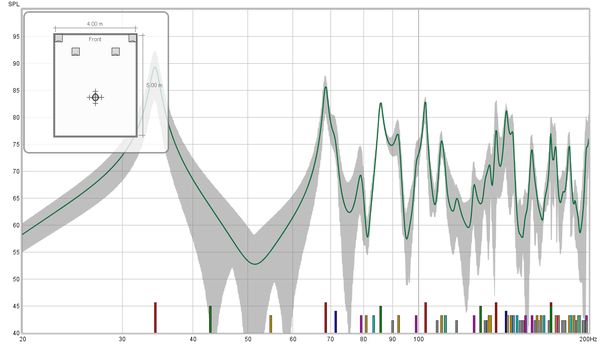
The Combined response at Main mic posn button produces a measurement showing the simulated response at the Main mic position when all the currently selected sources are active. Combined response at selected mic posns produces a measurement showing the average of the simulated responses at the currently selected mic positions when all the currently selected sources are active, with an underlay showing the overall span of the individual responses.
Individual responses at Main mic posn produces a set of measurements, one for each of the currently selected sources, showing the simulated response at the Main mic position from that source. Individual responses at selected mic posns produces a set of measurements, one for each of the currently selected sources, showing the average of the simulated responses at the currently selected mic positions when that source is active, with an underlay showing the overall span of the individual responses.
The measurements generated include the room dimensions and speaker and mic
positions, a plan view of the room configuration used to produce the measurement
can be shown on the SPL & Phase graph by selecting Show room panel in the
graph controls. The view has the same highlighting features as the room simulator
view, except positions cannot be altered.