The Analysis preferences alter the way REW carries out some of its calculations.
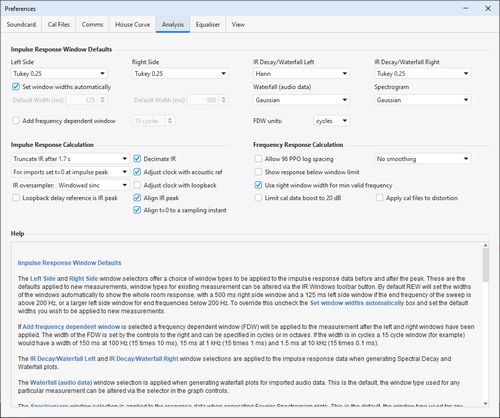
The Left side and Right side window selectors offer a choice of window types to be applied to the impulse response data before and after the peak. These are the defaults applied to new measurements, window types for existing measurement can be altered via the IR Windows toolbar button. By default REW will set the widths of the windows automatically to show the whole room response, with a 500 ms right side window and a 125 ms left side window if the end frequency of the sweep is above 200 Hz, or a larger left side window for end frequencies below 200 Hz. To override this uncheck the Set window widths automatically box and set the default widths you wish to be applied to new measurements.
If Add frequency dependent window is selected a frequency dependent window (FDW) will be applied to the measurement after the left and right windows have been applied. The width of the FDW is set by the controls to the right and can be specified in cycles or in octaves. If the width is in cycles a 15 cycle window (for example) would have a width of 150 ms at 100 Hz (15 times 10 ms), 15 ms at 1 kHz (15 times 1 ms) and 1.5 ms at 10 kHz (15 times 0.1 ms).
The IR decay/waterfall left and IR decay/waterfall right window selections are applied to the impulse response data when generating Spectral Decay and Waterfall plots.
The Waterfall (audio data) window selection is applied when generating waterfall plots for imported audio data. This is the default, the window type used for any particular measurement can be altered via the selector in the graph controls.
The Spectrogram window selection is applied to the response data when generating Fourier Spectrogram plots. This is the default, the window type used for any particular measurement can be altered via the selector in the graph controls.
After REW has made a measurement it can truncate the derived impulse response to preserve the important information while minimising the storage required for the measurement file. A 1 second period is retained before the peak, and by default a 1.7 second period is retained after the peak (this varies a little depending on the sample rate, at 44.1k (or multiples) it is approx 2 seconds, at 48k 1.7 seconds). In some cases it may be useful to retain more of the impulse response, such as measurements in very large spaces which have very long impulse responses. REW provides options to truncate the response after approx 4.4 seconds, or 9.9 seconds, or to retain the entire impulse response. It may also be necessary to use a longer sweep (with a 256k sweep there is about 6 seconds of impulse response data available after the peak). WARNING: retaining the entire impulse response ("Keep full IR") will produce an impulse response that is twice as long as the sweep used, generating much larger measurement files and slowing down IR plotting and processing. If the entire response is retained the peak will be centred within the response.
When impulse responses are imported the t=0 position can be set to either the first sample in the imported data, the location of the peak of the impulse response or the specific sample index shown.
When REW generates an impulse response it is oversampled to provide data for graph rendering. The method used to generate that oversampled data is set by the IR oversampler setting. Windowed sinc uses a bandlimited interpolator, FFT time shift uses fractional delays implemented via the time shift property of the FFT, None disables IR oversampling (in which case Hermite interpolation is used in the graph plot generation between the original sample points). Windowed sinc is the default setting. This setting does not affect IR imports, which are not oversampled.
The Decimate IR selection controls whether REW reduces the sample rate of the impulse response to correspond to the range of frequencies in the measurement. Selecting this option greatly reduces the impulse response size for low frequency measurements and speeds up processing of the data.
The Adjust clock with acoustic ref selection controls whether REW compensates for clock rate differences between input and output when using the acoustic timing reference. If this option is selected an additional timing reference signal is played at at the end of the sweep and the time between the timing reference signals is used to calculate any clock adjustment required to match the input and output device clock rates.
The Adjust clock with loopback selection controls whether REW compensates for clock rate differences between input and output when using a loopback as a timing reference. If this option is selected the loopback signal is analysed to calculate any clock adjustment required to match the input and output device clock rates. To apply this correction the sweep must start below 1 kHz and end above 10 kHz.
If Loopback delay reference is IR peak is selected the system delay figure for loopback measurements is the relative times of the measured and loopback IR peaks. If it is not selected the system delay figure will use the estimated IR delay relative to the loopback when the peak is close to the IR start or the estimated IR start time relative to the loopback when the peak is later (limited bandwidth devices). The system delay figure for the acoustic timing reference always uses the estimated IR delay/estimated IR start.
If Align IR peak is selected the impulse response for a new measurement will be shifted (if necessary) by a fraction of a sample so that the peak, which typically lies between samples (depending on the system delay), occurs at a sampling instant.
If Align t=0 to a sampling instant is selected any change to the impulse response t=0 position will include any fractional sample shift necessary to ensure t=0 occurs at a sampling instant.
The Allow 96 PPO log spacing selection controls whether REW is permitted to convert frequency responses from linearly spaced data to logarithmically spaced data at 96 points per octave. The FFT that calculates the frequency responses produces data that is linearly spaced in frequency, i.e. there is a constant frequency step from each value to the next. For the high frequency parts of responses this means there are a very large number of points, using a lot of memory but not contributing anything useful to the displayed data. When this option is selected (it is on by default) REW will automatically convert frequency responses to more efficient logarithmic spacing with 96 data points in each octave of the response if this will reduce memory usage (which is usually the case for sweeps that end above 300 Hz or so). As part of the conversion process REW first applies a 1/48th octave smoothing filter to the data to remove any high frequency combing from the response. The conversion takes place on any new measurement or when an IR Window is applied. Whether a measurement is log spaced or linearly spaced can be seen by bringing up the measurement info window by clicking the info button in the toolbar.
Note that conversion to 96 PPO is inhibited if the impulse peak is far from the impulse zero time, where "far" means the peak is offset from zero by a time that corresponds to more than 90 degrees of phase shift between samples at the measurement end frequency. This is to prevent aliased phase data at high frequencies which would lead to incorrect group delay figures.
The Show response below window limit selection controls whether REW displays the frequency and phase responses at frequencies lower than those valid for the current impulse response window width. For example, if the window width were 10 ms frequencies below 100 Hz would not be valid and are normally not displayed. There are circumstances in which it may be helpful to see that data, which this option allows, but the responses are drawn dashed to indicate they lie below the window cutoff. The Use right window width for min valid frequency selection controls whether the total or right hand window width is used for the minimum frequency calculation, the right hand window is the determining factor when the window reference time is at or near the IR peak, which is usually the case.
The default smoothing to apply to new SPL measurements can be selected from the drop-down box next to the log spacing check box.
If Limit cal data boost to 20 dB is selected REW will limit the total gain applied to compensate for calibration data attenuation to 20 dB. This prevents excessive boosting of the noise floor in areas where the combined mic/meter and soundcard response is more than 20 dB down. This setting affects the frequency response, RTA trace and SPL meter readings and is also applied when carrying out trace arithmetic.
If Apply cal files to distortion is selected REW will applying the cal files to distortion results. Applying the files provides more accurate results in regions where the fundamental or harmonics are affected by interface roll-offs but also boosts the noise floor in those regions.