The SPL Meter is an integrating, logging sound level meter that displays sound pressure level, equivalent sound level or sound exposure level based on the RMS level of the input channel. It offers A, C and Z weightings, fast or slow exponential filters, a high pass filter to suppress wind noise, and records minimum, maximum and unweighted peak levels. The peak reading is based on the largest absolute sample value seen in each block of audio data.
The meter takes into account both the soundcard and microphone calibration files
and corrects its readings accordingly, allowing IEC class 0 performance when used with
a calibrated microphone and SPL calibrator. Note that the maximum boost resulting from
the calibration files can be limited by a setting in the
Analysis Preferences
to prevent excessive boosting of the noise floor.
Data recorded by the meter can be logged, graphed and saved to a text file.
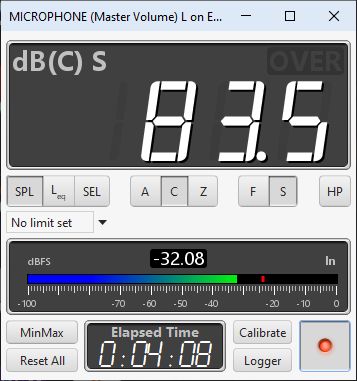
The meter displays either sound pressure level (SPL), time-average equivalent sound level (Leq) or sound exposure level (LE) according to the selection made on the buttons below the display. In Leq mode the figure can be either the level since the last meter start or reset or a rolling figure over the time interval set below the selection buttons. The SPL reading is filtered with either a "Fast" (125ms) or "Slow" (1s) time constant, selected via the F/S buttons. For general use the "Slow" setting is best. When the HP button is pressed a high pass filter is applied that eliminates content below approximately 8Hz.
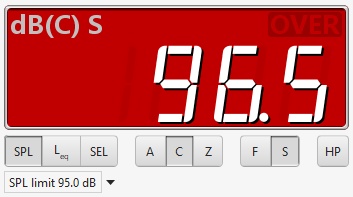
Limits can be set independently for the SPL, Leq and SEL values.
When using the pro upgrade multi-input capture option limits each SPL meter
can have different limits. When limits are being used the background of the
meter is green when the level is more than the amber threshold below the limit.
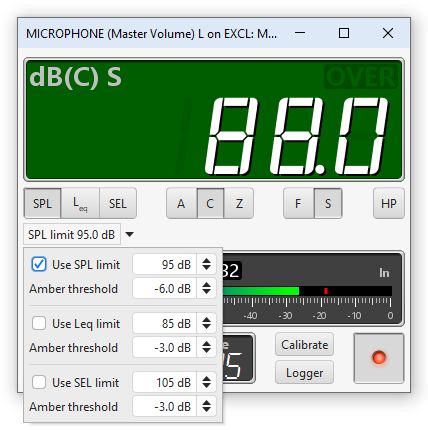
Within the amber threshold of the limit the background of the meter turns amber.
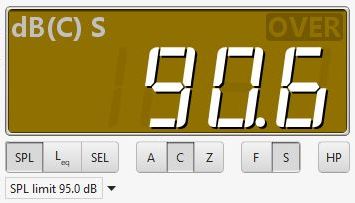
Above the limit the background of the meter turns red.
SPL measurements use weighting curves to shape the signal they
receive and emphasise those regions that are of interest for certain
requirements. The A and C-weighting curves are shown in the figure below.
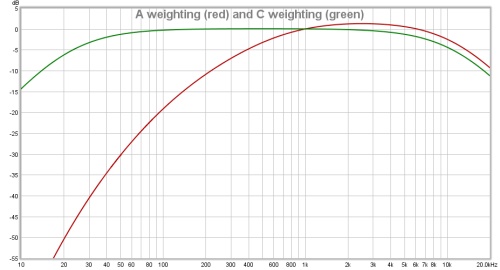
C-weighting gives the broadest response (apart from the "Flat", "Zero"
or "Z" weighting), with -3dB points at 31.5Hz and 8kHz.
A-weighting has a much more pronounced low frequency roll-off. It is
modelled on the sensitivity of the ear to low level sounds (about 40dB SPL).
A-weighting has the same high frequency roll-off shape as C, but the curves
do not align at high frequencies because they are adjusted to both have zero
gain at 1kHz, which shifts the A-weighting curve up relative to C-weighting.
When Z-weighting is used the SPL figure includes the components at DC and the
Nyquist frequency (half the sample rate).
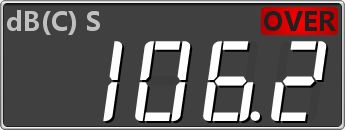
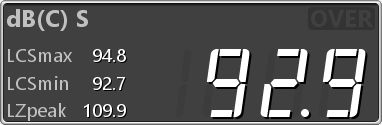
The meter display shows the currently selected measure, the level and an
overload ("OVER") indicator which is lit if the soundcard input range is
exceeded. The OVER indicator can be reset by clicking in the display area
or using the Reset All button. When SPL is selected the display
shows dB, the selected weighting in brackets (A, C or Z) and either F for
Fast or S for Slow. When measuring equivalent sound level it shows LAeq,
LCeq or LZeq according to the selected weighting. SEL is displayed when
measuring sound exposure level. The time over which the equivalent sound
level or sound exposure level figures have been calculated is shown in the
Elapsed Time display at the bottom of the meter. Note that equivalent
sound level is useful for making measurements of subwoofer levels using your
processor or receiver's internal calibration signal, usually difficult due
to the large fluctuations of the level. Equivalent sound level displays a
result averaged over the time since Reset All was last pressed;
simply start the test signal, press Reset All and wait for the
reading to stabilise to get a precise level.
The SPL meter window can be resized as required, the main SPL display digits
automatically scale to suit the available space. The meter can also be set to
full screen.
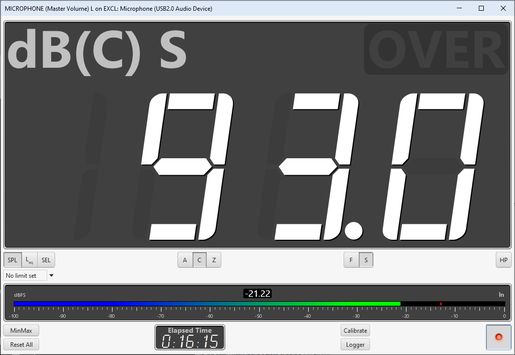
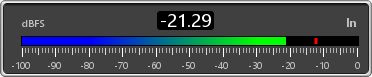
Below the main row of controls a level meter shows the current soundcard
input level in dBFS, the peak is shown by the red bar while the numeric
indicator and the coloured bar show the rms level.
Below the soundcard level meter is a MinMax button to display min, max and
peak values in the SPL display and a Reset All button to reset the
elapsed time, min, max and peak values, equivalent sound level, sound exposure
level and the overload indicator. The Calibrate button starts the
meter calibration process, whilst the record button turns the meter on or off.
When MinMax is selected the values are displayed alongside the main reading.
The soundcard input channel which is measured is selected in the Soundcard Preferences. Setting the audio input is described in Getting started.
Valid readings are not displayed until SPL Calibration has been carried out. The SPL reading may be calibrated against an external SPL meter or SPL calibrator by pressing the Calibrate button. The text on the button and the SPL meter digits are red if the meter has not been calibrated. If the soundcard input is altered in the REW soundcard preferences, or if the input levels are altered, it will be necessary to re-calibrate the SPL meter reading.
The Logger button opens the SPL Logger graph window. The record button in the top right corner of the SPL Logger graph starts or stops logging of SPL values. When logging is in progress the SPL meter on/off, calibrate, weighting, filter time constant and high pass filter buttons are disabled. The logger records the SPL (with the currently selected weighting and time constant), the minimum and maximum values, the unweighted and uncalibrated peak value, the equivalent sound level and the sound exposure level. A Save button above the SPL Logger graph allows the data recorded to be saved to a text file using the text delimiter set in the REW File menu, log files can be loaded using the Open button.
The control panel for the SPL logger graph has these controls:
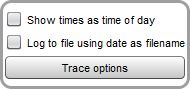
If Show times as time of day is selected the time axis shows the time of day of the logged data, otherwise it shows the elapsed time since logging started. Selecting Log to file using date as filename saves logged data to files in the REW logs directory automatically whenever the logger is running (the directory location is shown in the About REW dialog box). Filenames are formatted as SPL-YYYY-MMM-dd.txt, e.g. SPL-2016-Apr-24.txt. If a file for a day already exists a number will be appended, e.g. SPL-2016-Apr-24-1.txt, SPL-2016-Apr-24-2.txt etc. A new file is created if the logging continues past midnight, with the new date. Note that the files can become very large if logging continues for a long period, growing at about 18 kB per minute. If the option to log to files is selected remember to check the REW log directory to remove files you no longer need.
The Trace options button brings up a dialog that allows the colour and line type of the graph traces to be changed. If a change is made it will be used for all measurements shown on this graph. Traces can also be hidden, which will remove them from the graph and from the graph legend.
The format of the logged data is shown below, in this example the text
delimiter is comma and the SPL meter was set to Z weighting.
    SPL log data saved by REW V5.19
    Note: includes Leq over last minute and last 10 minutes
    Soundcard cal:
    Mic/meter cal:
    SPL cal offset: 104.85347938537598 dB
    High Pass Filter: Off
    Date: 16-Jul-2018 17:43:10
    Start: 1531762990157
    Log length: 7061 entries over 1311.6s
    Log interval: 0.18575963718820862 seconds

    Time[s], LZS, LZSMin, LZSMax, LZpeak, LZeq, LZE, LZeq1m, LZeq10m
    0.186, 84.7, 84.7, 84.7, 95.1, 84.6, 77.3, 84.6, 84.6, 17:43:10.186
    0.372, 84.7, 84.6, 84.7, 96.1, 84.7, 80.4, 84.7, 84.7, 17:43:10.372
    0.557, 84.6, 84.6, 84.7, 96.1, 84.5, 82.0, 84.5, 84.5, 17:43:10.557
    0.743, 84.7, 84.5, 84.7, 96.1, 84.6, 83.3, 84.6, 84.6, 17:43:10.743
    0.929, 84.7, 84.5, 84.7, 96.1, 84.6, 84.3, 84.6, 84.6, 17:43:10.929