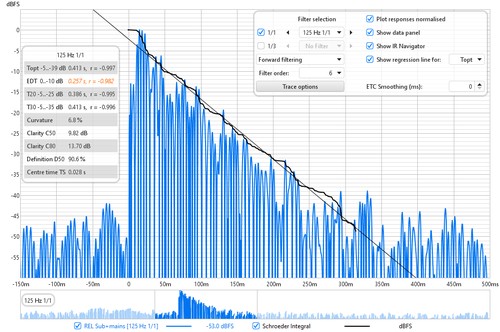
The Filtered IR graph allow octave and one-third octave filters to be applied to the measurement. The octave band filters are Butterworth bandpass, with the order selected in the graph controls. The graph is primarily aimed at examining decay behaviour in different frequency bands and analysing the results per ISO 3382. In addition to the filtered impulse response itself this graph includes traces of the impulse response envelope (ETC) and the Schroeder integral, from which RT60 estimates are derived.
The Schroeder Integral is a curve obtained by backwards integration of the squared impulse response, ideally starting from a point where the response falls into the noise and applying a correction (a starting value for the integral) which assumes the rate at which the Schroeder curve is falling continues for the whole response. REW uses an iterative procedure to estimate the best starting point for the integration, based on "Lundeby's Method" (from the paper by A. Lundeby, T. E. Vigran, H. Bietz, and M. Vorländer, “Uncertainties of Measurements in Room Acoustics,” Acustica, vol. 81, pp. 344–355 (1995)). The slope of this curve is used to measure how fast the impulse response is decaying, deriving a figure for "RT60" which is the time it would take sound to decay by 60dB. The curve shown on the graph is for the currently applied filter, if any. When calculating decay data for the octave and one-third octave RT60 results the impulse is first filtered to the corresponding bandwidth and centre frequency before the Schroeder Integral for that band is determined and the various RT60 measures calculated.
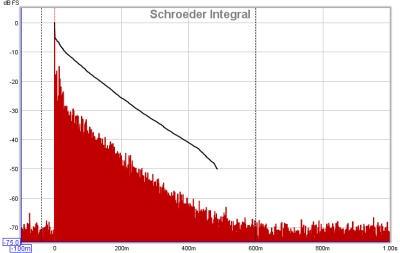
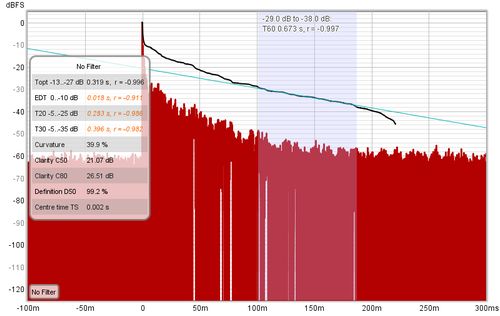
If a Schroeder Integral range is selected by holding the shift key then pressing and dragging with the left mouse button a regression line for the selected range is displayed, with the corresponding T60 value. The range can be adjusted after selection by dragging the start or end of the area, or the whole range can be moved. The Y axis must be set to dBFS.
The control panel for the Filtered IR graph has these controls:
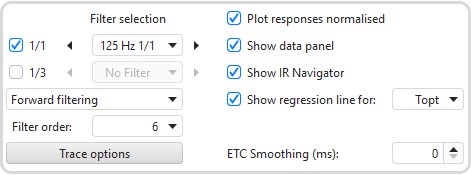
Octave and 1/3 octave filters can be selected using the 1/1 and 1/3 boxes, which enable the corresponding set of controls. The required filter frequency can be chosen directly from the drop-down list or stepped through using the buttons either side. The filter is applied to the Impulse Response upon selection, a label in the bottom left corner of the graph shows the current filter setting. The filter remains active until "No Filter" is selected or the boxes are unchecked. The measurement name on all graphs is shown with an indication of the applied filter, for example "Auditorium [250Hz 1/3]". The filters are Butterworth bandpass, whose order is determined by the selection in the Filter order control. Orders from 6 to 48 may be selected, the default is 6. Note that higher filter orders have correspondingly higher group delays, which may affect the RT60 estimates if the RT60 values are low (fast decays in a heavily treated space, for example). Using Time reversed filtering can avoid that potential issue.
The Filtering control provides a choice of Forward filtering, Time-reversed filtering or Zero phase filtering. Time-reversed filtering applies the octave band filters backwards in time, this greatly reduces the filter's own contribution to the measured decay. When using 1/3 octave filters at low frequencies the filter decay time can be significant, over 200 ms for a 100Hz 1/3 filter, for example. Applying the filter in reverse reduces this decay to less than 50 ms, but it does affect the response somewhat, such that Early Decay Time (EDT) figures using Time-Reversed filters may not be valid. Zero phase filtering applies the filters in two passes through the data, one forwards and one reversed, to give a response with overall zero phase shift. This reduces the contribution of the filter's decay time similar to (though not as much as) time reversed filtering but without significantly affecting early decay time. The filter order used for the backward and forward passes is two thirds of the Filter order value, which together with a bandwidth adjustment gives a response that is close to that of a single pass of a filter of the specified order.
The impulse response may be plotted with or without normalisation to its peak value according to the setting of the Plot responses normalised control. When normalised plotting is selected the peak will be at 100% or 0 dBFS.
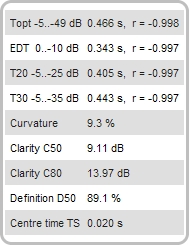
The Show data panel control shows a panel on the graph containing the results
for the decay values. The RT60 figures include the decay range over which they have been
calculated and an "r" value, the regression coefficient, which measures how well the data
corresponds to a straight line. A value of -1 would indicate a perfect fit, values lower
in magnitude than -0.98 indicate the corresponding decay figure may not be reliable.
Unreliable figures are italicised and shown orange.
The parameters available are:
If Show IR Navigator is selected the navigator view is shown below the graph.
The graph can also show the "Regression Line", which is a line obtained by carrying out least squares linear regression on the Schroeder curve over the range applicable to any particular decay parameter. The selector for which regression line is to be shown is next to the Show Regression Line check box.
ETC Smoothing is used to smooth the envelope (ETC) trace using a moving average filter of the duration specified in the spinner.
The Trace options button brings up a dialog that allows the colour and line type of the graph traces to be changed. If a change is made it will be used for all measurements shown on this graph. Traces can also be hidden, which will remove them from the graph and from the graph legend.