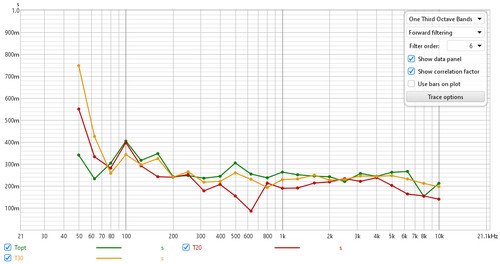
RT60 Reverberation Time values at each octave or one-third octave centre frequency are displayed on this graph, with separate traces for the Early Decay time (EDT), Centre Time (TS) and the 60dB decay times T20, T30 and REW's Topt and T60M. See below for descriptions of each of those parameters and the related clarity, definition and centre time parameters.
RT60 is a measure of how long sound takes to decay by 60 dB in a space that has a diffuse soundfield, meaning a room large enough that reflections from the source reach the mic from all directions at the same level. Domestic rooms are usually too small to have anything approaching a diffuse field at low frequencies as their behaviour in that region is dominated by modal resonances. As a result RT60 is typically not meaningful in such rooms below a few hundred Hz. Use the RT60 Decay, waterfall, spectrogram and Decay plots to examine the decay of low frequencies in domestically-sized rooms.
The RT60 values are estimated by calculating the slope of the Schroeder curve, which is a plot of the energy (squared values) of the impulse response that is backwards integrated (summed starting from the end and moving backwards). The vertical axis of the plot is in dB. The different RT60 measures (e.g. T20, T30, REW's Topt) are derived by calculating the slope of a best fit line to the Schroeder curve over different ranges (detailed below). In a diffuse field the curve with the dB vertical scale is quite linear until it reaches the noise floor.
The start point for the classical T20 and T30 measures of RT60 is where the Schroeder curve has dropped 5 dB below its peak. That works well in the large spaces for which RT60 is most applicable, particularly if the source used for the measurement is omnidirectional. In domestically sized rooms using normal, directional loudspeakers as sources the initial drop of the Schroeder curve is quite sharp (the Early Decay Time is quite short) meaning the -5 dB point lies within the early decay region rather than the diffuse field region. That in turn means the T20 and T30 figures underestimate the RT60 time. Where the EDT is much shorter than the T30 RT60 figure REW's Topt RT60 calculation uses a start point based on the intersection of the EDT and T30 regression lines, to determine a point that lies within the diffuse field region. It then tests each possible end point in 1 dB steps and picks the one that gives a regression line with the best linear fit. That produces a more reliable RT60 figure.
The results are presented within octave or 1/3 octave bands, providing a view of how the rate at which sound decays changes with frequency. The lowest centre frequency for the RT60 plot is 50 Hz at 1/3 octave and 63 Hz at 1 octave, per ISO3382. For domestic listening rooms and recording studios with volumes of less than 50 cubic metres (1,800 cubic feet) the recommended RT60 value is 0.3 s. For larger rooms, up to 200 cubic metres (7,000 cubic feet) the recommendation is 0.4 to 0.6 s. In both cases the value should be fairly uniform across the frequency range, though it will typically tend to increase at lower frequencies.
Important: If you are making RT60 measurements in a large space (bigger than a domestic room) change the IR truncation setting in the Analysis preferences to make sure enough of the IR is retained for the decay to reach the noise floor. It may also be necessary to use a longer sweep (with a 256k sweep there are about 6 seconds of IR data after the peak before any truncation is applied).
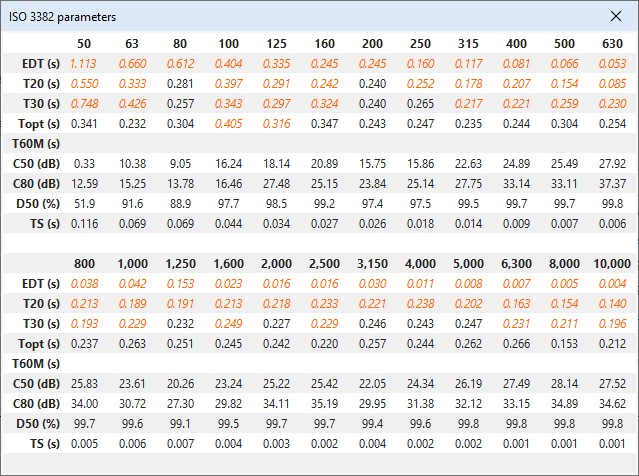
The parameters which are calculated are:
The control panel for the RT60 graph has these controls:
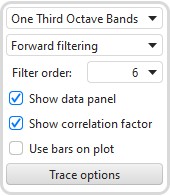
RT60 data can be shown in octave or one-third octave bands. The Filter order selection controls how steeply the fractional octave band filters roll off. The default order is 6 and that gives results comparable with most other software. Higher filter order makes the bands more selective, which can help isolate longer decays to a particular band, but increasing filter order also increases the delay of the filter itself. That can be mitigated by using Time-reversed filtering or Zero phase filtering.
The Filtering control provides a choice of Forward filtering, Time-reversed filtering or Zero phase filtering. Time-reversed filtering applies the octave band filters backwards in time, this greatly reduces the filter's own contribution to the measured decay. When using 1/3 octave filters at low frequencies the filter decay time can be significant, over 200 ms for a 100Hz 1/3 filter, for example. Applying the filter in reverse reduces this decay to less than 50 ms, but it does affect the response somewhat, such that Early Decay Time (EDT) figures using Time-Reversed filters may not be valid. Zero phase filtering applies the filters in two passes through the data, one forwards and one reversed, to give a response with overall zero phase shift. This reduces the contribution of the filter's decay time similar to (though not as much as) time reversed filtering but without significantly affecting early decay time. The filter order used for the backward and forward passes is two thirds of the Filter order value, which together with a bandwidth adjustment gives a response that is close to that of a single pass of a filter of the specified order.
The Show data panel control shows a panel on the graph containing the results
for the decay values. Unreliable figures are italicised and shown orange.
If the Show correlation factor box is checked the graph legend names shows the quality of the line fit for the various decay measures. The "r" value shown after each decay measure is the regression coefficient, which measures how well the data corresponds to a straight line. A value of -1 would indicate a perfect fit, values lower in magnitude than -0.99 indicate the corresponding decay figure may not be reliable. Potentially unreliable values are italicised.
The RT60 plot can show horizontal bars centred on each filter frequency and spanning the filter's bandwidth, or lines joining the filter centre frequencies, according to the Use bars on plot control setting.
The Trace options button brings up a dialog that allows the colour and line type of the graph traces to be changed. If a change is made it will be used for all measurements shown on this graph. Traces can also be hidden, which will remove them from the graph and from the graph legend.
The parameter values (RT60 and clarity) for the current measurement can be written to a text file using the File → Export → RT60 data as text menu entry.