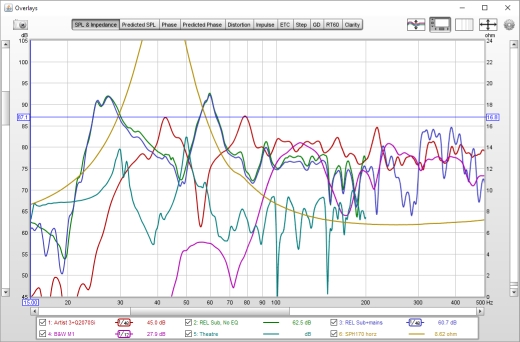
The overlays window shows plots for all the currently loaded measurements.
It is shown by pressing the Overlays button in the toolbar of the main REW window.
![]()
The overlay plots are selected via the buttons at the top of the graph area.

The various graph types are:
The basic controls for the overlay graphs are described in the main
Graph Panel help, but the Overlays window
has one additional button:

The Separate Traces button to the right of the graph selector offsets
each trace downwards from the preceding trace to make it easier to distinguish
individual features when the traces are at similar levels. When the button has
been pressed a slider next to it allows the amount of separation to be adjusted.


The Actions button brings up a menu of actions for the currently selected graph type. All
overlay graphs have these actions:
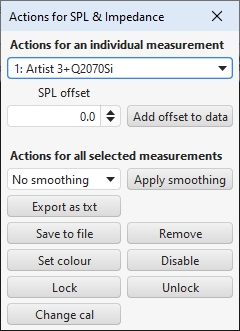
The SPL overlay graph has an action to apply an SPL offset to an individual measurement. The SPL offset moves the graph position, but does not alter the data so the legend values do not change. If the Add offset to data button is pressed the current offset value is transferred to the measurement data and the legend readings will update accordingly.
The SPL, Predicted SPL, Phase, Predicted Phase and Group Delay overlays have actions to apply smoothing to all the currently selected traces.
The SPL overlay has an action to export all the selected measurements as text.
The Phase and Predicted Phase overlays have additional actions to wrap or unwrap the currently selected phase traces.
The Impulse overlay has actions to set the t=0 position, undo t=0 changes, remove IR delays, export as text and export as WAV.
The RT60 overlay has actions to export the average of the selected measurements and an action to export the RT60 data for all the selected measurements.
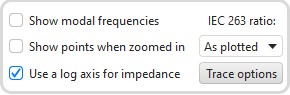
The SPL, Phase, Impulse, Step and Group Delay overlays have a Show points when zoomed in control. If selected the individual points that make up the measured responses are shown when the zoom level is high enough for them to be distinguished (which may only be over part of the plot).
The SPL and Predicted SPL overlays have an IEC 263 ratio control which allows the graph to be locked to a specified dB/decade aspect ratio. The aspect ratio is maintained by adjusting the margins around the graph as required.
The Impulse overlay has controls to filter the selected measurements.
All overlay graphs have a Trace options button which brings up a dialog that allows the line type of the graph traces to be changed.
Right clicking in the legend area of an overlay graph brings up a small menu that allows all traces to be selected, all selections to be cleared or the selections to be toggled. There are also menus to select or clear traces for measurements that have been loaded from a particular file. A range of traces may be selected by holding the shift key while clicking the selection box for the start of the range then clicking the box for the end of the range.
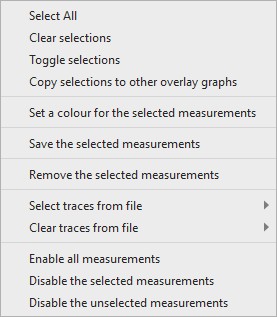
Individual measurements can be disabled by right clicking on the measurement's thumbnail. The currently selected measurement can be disabled using the Ctrl+D shortcut. Disabled measurements cannot be selected, are skipped when using the next/previous measurement shortcuts (Alt+up/down and Ctrl+up/down) and are not shown in the legends of overlay graphs. All measurements can be re-enabled via an entry in the right-click menu of the graph legend or by using the Ctrl+E shortcut. All selected or all unselected measurements can be disabled via the entries in the right-click menu of the overlay graph legend.
Hovering the cursor over the name of a measurement in the legend panel will bring up a tool tip showing the measurement notes. It will also highlight the measurement on the graph. When a measurement is selected it will automatically be highlighted, the highlight for the currently selected measurement can be toggled using the Ctrl+H shortcut.