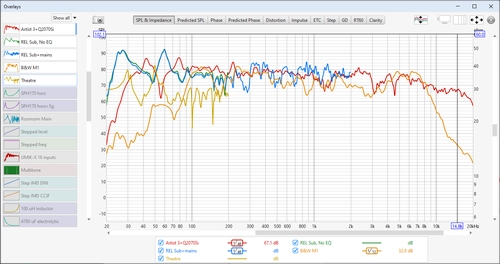
The overlays window shows plots for all the currently loaded measurements.
It is shown by pressing the Overlays button in the toolbar of the main REW window.
![]()
At the left hand side of the overlays window is the measurement selector, used to choose which measurements appear on the graphs. If measurements are in groups they will all be selected when the group is expanded and all deselected when the group is collapsed. Individual measurements can be selected or deselected by clicking on them. Multiple selections can be made by left click and drag, or by clicking and then doing a Shift+left click at the end of the range.
Measurements can be rearranged by dragging them to a new position in the list. If the measurement list has focus (blue border around an entry) keyboard shortcuts to select all (Ctrl+A), cut (Ctrl+X) and paste (Ctrl+V) may also be used. Pasted measurements are placed before the first selected measurement or, if there are no selections, at the end of the list.
The measurement which is currently selected in the main REW window has a blue bar at the right hand side.
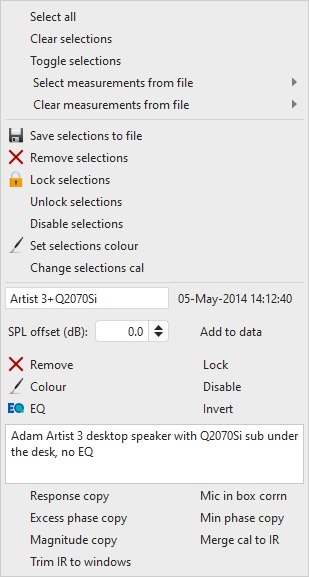
Right clicking on the selector after multiple measurements have been selected brings up a set of actions to save, remove, lock, unlock, add to group, change colour or change cal data for the selected measurements. There are also actions to select all, clear selections, toggle selections and select or clear measurements for a specific file amongst those files loaded. Below those actions are a set of actions for the measurement where the mouse was clicked.
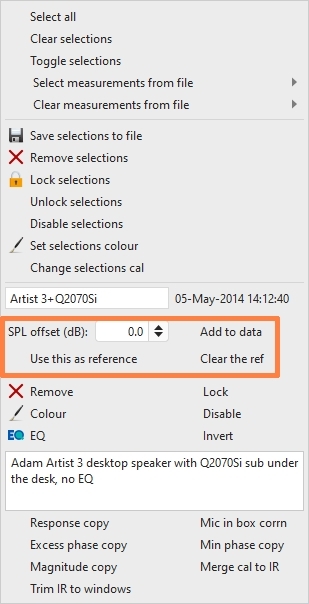
Right clicking on the selector when there are no selections or just one selection brings up a set of actions to actions to select all, clear selections, toggle selections and select or clear measurements for a specific file amongst those files loaded and a menu like the measurement panel right click menu for the measurement clicked on. That menu has additional actions that depend on the current graph, in the example below there are controls to adjust the SPL offset and to set a measurement as a reference for other measurements, highlighted in orange.
The overlay graphs are selected via the buttons at the top of the graph area.

The various graph types are:
The basic controls for the overlay graphs are described in the main
Graph Panel help, but the Overlays window
has one additional button:

The Separate Traces button to the right of the graph selector offsets
each trace downwards from the preceding trace to make it easier to distinguish
individual features when the traces are at similar levels. When the button has
been pressed a slider next to it allows the amount of separation to be adjusted.

Right clicking on the graph brings up a menu of actions for the currently selected graph type, along with some shortcuts to quickly move to other REW windows.
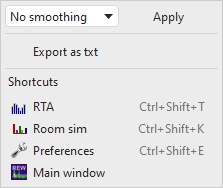
The SPL, Predicted SPL, Phase, Predicted Phase and Group Delay overlays have actions to apply smoothing to all the currently selected traces.
The SPL overlay also has an action to export all the selected measurements as text.
The Predicted SPL overlay has an action to copy equaliser and filter settings from one measurement to all the selected measurements.
The Phase and Predicted Phase overlays have actions to wrap or unwrap the currently selected phase traces.
The Impulse overlay has actions to set the t=0 position, undo t=0 changes, remove IR delays, export as text and export as WAV.
The RT60 overlay has actions to export the average of the selected measurements and an action to export the RT60 data for all the selected measurements.
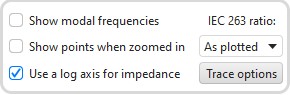
The SPL, Phase, Impulse, Step and Group Delay overlays have a Show points when zoomed in control. If selected the individual points that make up the measured responses are shown when the zoom level is high enough for them to be distinguished (which may only be over part of the plot).
The SPL and Predicted SPL overlays have an IEC 263 ratio control which allows the graph to be locked to a specified dB/decade aspect ratio. The aspect ratio is maintained by adjusting the margins around the graph as required.
The Impulse overlay has controls to filter the selected measurements.
All overlay graphs have a Trace options button which brings up a dialog that allows the line type of the graph traces to be changed.
Right clicking in the legend area of an overlay graph brings up a small menu that allows all traces to be selected, all selections to be cleared or the selections to be toggled.
Hovering the cursor over the name of a measurement in the legend panel will highlight the measurement on the graph. When a measurement is selected it will automatically be highlighted, if that option is selected in the trace highlight options of the View preferences. The highlight for the currently selected measurement can be toggled using the Ctrl+H shortcut.