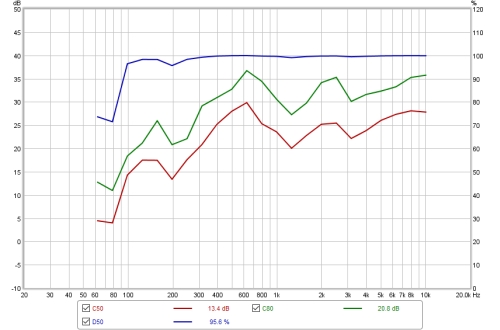
The C50, C80 and D50 clarity and definition curves at each octave or one-third octave filter centre frequency are displayed on this graph. See below for descriptions of each of these parameters.
The control panel for the Clarity graph has these controls:
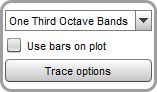
The band selector chooses either octave or one-third octave filtered results. The filtering settings used are those on the RT60 graph.
The plot can show horizontal bars centred on each filter frequency and spanning the filter's bandwidth, or lines joining the filter centre frequencies, according to the Use bars on plot control setting.
The Trace options button brings up a dialog that allows the colour and line type of the graph traces to be changed. If a change is made it will be used for all measurements shown on this graph. Traces can also be hidden, which will remove them from the graph and from the graph legend.
The clarity measures available are:
The parameter values (RT60 and clarity) for the current measurement can be written to a text file using the File → Export → RT60 data as text menu entry.