The Signal Generator divides its signals into four groups, Tones, Multitone, Noise and Sweeps. Within those groups it offers the following signal types:
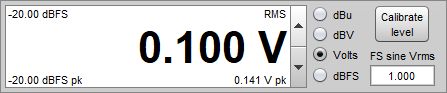
The RMS signal level can be set for any of the signal types with 0.01 dB
resolution relative to digital full scale. Display units of dBFS, dBu, dBV
and volts are offered. The arrow buttons on the RMS Level spinner change the
value in steps of 0.1dB, or any required value can be typed directly into
the level box. The level can be changed using the mouse wheel in steps of 1 dB,
or 0.1 dB if the Alt key is held down while scrolling the wheel, or 0.01 dB
if Ctrl+Alt are held down. The value will be converted as required, for example typing
775mV into the level control when in dBu mode will convert to 0 dBu (or -2.2
dBV). In modes other than dBFS the dBFS value is shown at the top left of the
level control.
The View setting for full scale sine determines whether a sine wave whose peaks reach digital full scale is assigned an rms level of 0 dBFS (the AES definition) or -3.01 dBFS (mathematically more correct).
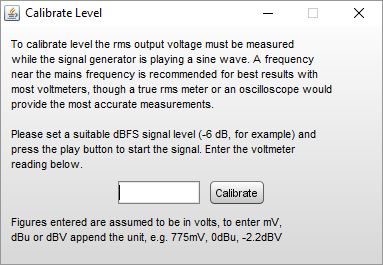
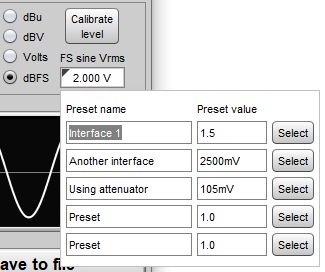
The output voltage levels are calibrated using the Calibrate level
button. To calibrate the level a sine wave signal should be played and the RMS
voltage that is produced measured using a multimeter or oscilloscope and entered
in the calibration dialog. Multimeters tend to be most accurate with signals that
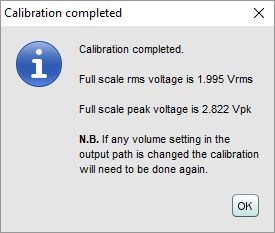
are around mains frequency. When the voltage reading has been entered the
corresponding full scale voltages (rms and peak) are displayed. If the output
scaling of the device being used is known (taking into account any volume control
settings) it can be entered directly into the text field below the
FS sine Vrms label.
If the output scaling of the device being used is known (taking into account any volume control settings) it can be entered directly into the text field below the FS sine Vrms label. Clicking in the triangle in the upper left corner brings up a list of preset values that may be entered, the labels and values can be changed as required.
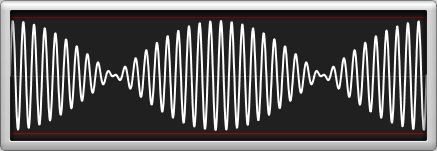
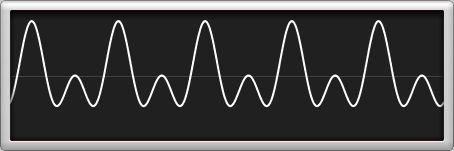
A preview of the signal waveform is shown below the level control. The
preview auto-scales to the range of the output, if the output is close to
digital full scale the full scale limits will be shown as red lines at the
top and bottom of the display.
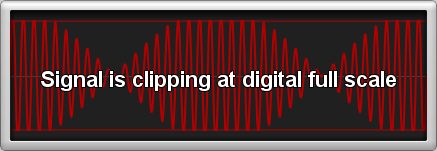
Signals which would exceed digital full scale cause the waveform display
to turn red and display a warning.
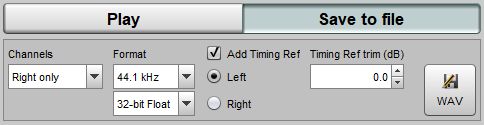
Setting the audio output device is described in
Getting Started. The output
on the chosen device can be selected in the signal generator within the
Play panel. When using Java drivers the signal can also be generated
on either or both channels of the output if it is stereo. If both channels are
being driven with Java drivers, or a secondary output has been selected with ASIO
drivers, the Invert second output box controls whether the second output
gets the same signal as the first or an inverted signal. The signal can additionally
be sent to the timing reference output, but that setting is ignored when running
check levels on the soundcard preferences or Measure dialog.
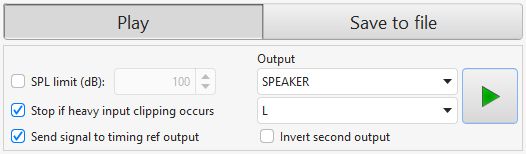
There are two protection mechanisms for the signal generator, aimed at avoiding excessive levels being generated. If SPL Limit is selected the generator will be stopped if the input SPL exceeds the figure set in the spinner. If Stop if heavy input clipping occurs is selected the generator will stop if more than 30% of the samples in an input signal block are above the clipping threshold. Note that the REW input must be running for these mechanisms to function, which means the SPL meter, level meters or RTA must be active.
The signals can be saved to a mono or stereo wave file containing the selected signal
in either or both channels. The options offered depend on the signal type - file
duration for a sine wave, for example, or number of repetitions for a tone burst.
The signal level in the file is per the RMS Level setting of the signal generator.
The sample rate and bit depth are as selected in the panel. If saving a measurement
sweep there is an option to include a timing reference, which is recommended.
Measurement sweep files may include 2 to 3 seconds of dither before the test signals
start to allow playback devices to lock to the source. Note that the REW measurement
sweep may change between REW versions so always save sweeps from the REW version being
used for analysis of the captured response.
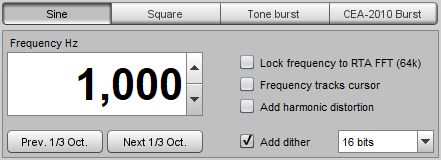
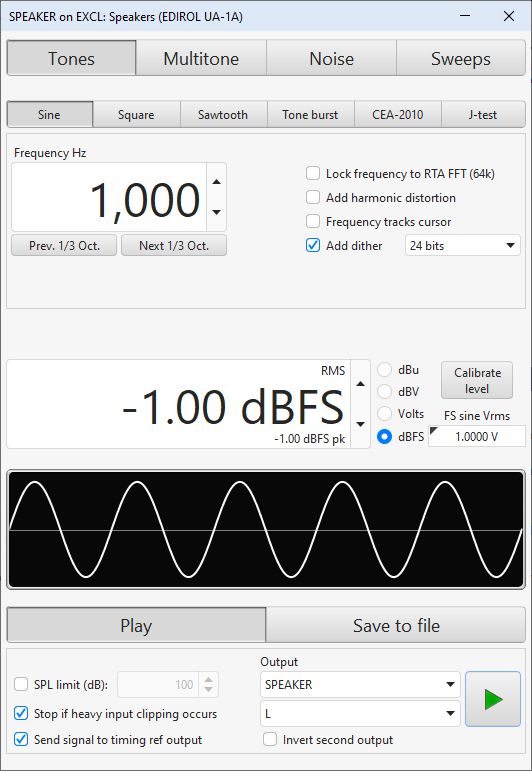
Sine waves can be generated with frequencies between 1.0 Hz and half the
soundcard sample rate, e.g. 24 kHz
for a soundcard operating at 48 kHz.
The frequency is controlled by entering a value in the Frequency box, or
using the arrow buttons to increment or decrement the value in steps of 0.5 Hz
for frequencies below 200 Hz and steps of 1 Hz thereafter. If the option to
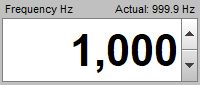
lock the frequency to the RTA FFT has been selected the actual frequency that has
been generated is shown at the top right corner of the frequency display
when the generator is running as it will typically differ slightly from the
entered frequency. The Prev. 1/3 Oct. and Next 1/3 Oct.
buttons move the generator to a one-third octave centre frequency.
When the Lock frequency to RTA FFT box is checked the generator
frequency is adjusted to the nearest FFT bin centre for the current RTA FFT
length (meaning the signal is periodic within the FFT length). This allows a
rectangular FFT window to be used for maximum spectral resolution of the RTA
plot. The FFT length is shown in brackets. The exact frequency that has been
generated is shown at the top right corner of the frequency display when the
generator is running.
The frequency can also be controlled via the graph cursor by checking
the Frequency tracks cursor box. When this box is checked the generator
frequency is linked to the position of the graph cursor and will change to
follow the cursor frequency as it is moved - the changes are smooth with no
phase discontinuities.
When the "add harmonic distortion" box is checked a window is displayed
allowing control over the levels and phases of harmonics from the 2nd to the 9th.
Each harmonic can be enabled or disabled using the check box. The levels are
adjusted in dB relative to the level of the fundamental, with the equivalent
percentage value shown in a label alongside. Above the controls is a display
of the maximum signal level that can be used with the current distortion
settings without clipping the output. Note that only harmonics that fall
within the range supported by the current sample rate are generated. The
signal preview includes the effects of any distortion selected.
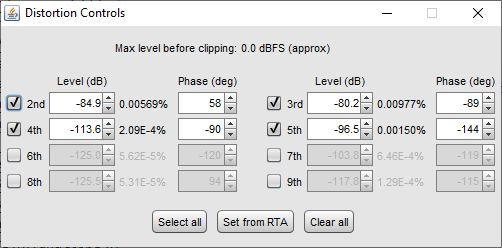
The harmonics dialog can be used to produce a pre-distorted signal to counter the distortion of a measurement system at a particular frequency and level. To use it in that way make an RTA measurement of the system measuring itself, running the generator at the desired frequency and level. Coherent averaging is recommended to minimise the effects of noise on the recovered harmonics. Once stable harmonic levels and phases are seen on the RTA press the Set from RTA button. Note that all the generator distortion harmonics should be off before making the RTA measurement, the Clear all button can be used to ensure that. THD improvements of around 20 dB may be achieved, but the settings are only valid at the frequency and signal level at which they were measured and will not remain valid if the measurement system distortion varies (as its temperature changes, for example).
The harmonics dialog can also be used to synthesise signals that use harmonics of a fundamental, such as approximations to a square wave (odd harmonics) or the polarity test signal below, which is generated using just the fundamental and a 0 dB 2nd harmonic at -90 degrees phase.
When the Add dither box is selected the generator adds 2 lsb pk-pk
triangular dither to the output to remove quantisation noise spikes. The level
at which the dither is added is controlled by the sample width selector to the
right of the check box. N.B. When using the Java drivers audio data is
limited to 16 bit precision on Windows. Dither is beneficial if making
very precise distortion measurements of an electronic device such as a receiver,
processor or equaliser. It is usually not required when making acoustic measurements
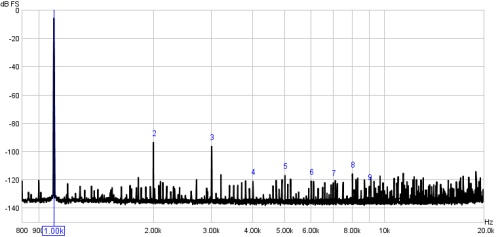
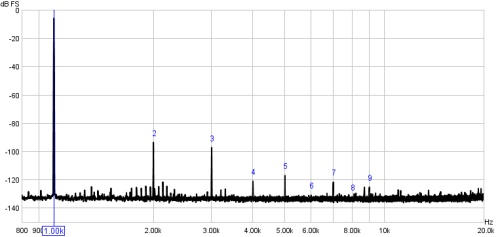
as the quantisation artefacts it removes are far below the acoustic noise floor. The
Graphs below show the effect of the dither option during a loopback test of a soundcard
playing a 1 kHz tone at -6 dBFS. The first plot is without dither, the second plot is
with dither. Addition of dither cleans up much of the noise that was apparent below
-120 dBFS, especially at high frequencies, making the true harmonic distortion levels
more visible.
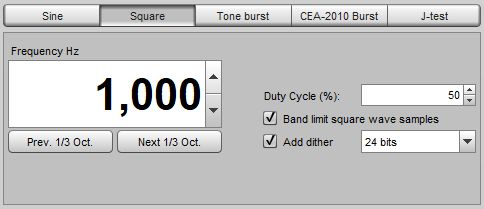
The square wave generator allows duty cycles between 1% and 99% in 1% steps. The sample values produced by the generator in each half of the square wave may be either equal-valued (the classical view of a square wave) or band-limited to half the sample rate. Equal-valued data will produce larger overshoots when the data is converted to an analog signal and will exhibit higher harmonic levels as the frequency approaches half the sample rate than a square wave should. It is also subject to a constraint that the frequency that is generated must be adjusted to ensure there is an even number of samples in the period, so that the spectrum of a 50% duty cycle square wave will only have odd harmonics. The actual frequency that has been generated is shown at the top right corner of the frequency display when the generator is running, at higher frequencies this can be significantly different to the frequency that was entered.
The option to Band limit square wave samples generates the data by
summing the constituent harmonics of the signal up to half the sample rate. This avoids
out-of band content in the raw data and produces correct harmonic levels throughout the bandwidth,
though the even-sample restriction REW applies to data that is not band limited mean the audible
difference is small for the 50% duty cycle case.
Note that the band limited signal may clip up to 1.5 dB sooner as the overshoots inherent
to the band limiting of sampled data appear in the sample values rather than being inter-sample
for the equal-valued case. However, the band-limited data will have less overshoot when converted
to analog. The frequency constraint for band limited data is much less strict, but for efficient
signal generation the exact frequency used will chosen so that the data values repeat within at
most 8192 samples. The frequency used will usually be within 0.1% of the requested frequency,
but the minimum frequency is 5.4 Hz at 44.1 kHz sample rate and proportionately higher at higher
sample rates. Dither should be applied when using the band limited option to avoid artefacts due
to quantisation, dither is not applicable for the equal-valued case as there are only two sample
values in the data.
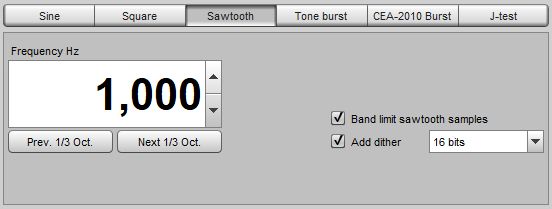
The sawtooth generator produces either idealised or band-limited sawtooth waveforms. The idealised version is subject to a constraint that the frequency that is generated must be adjusted to ensure there is an integer number of samples in the period, so that the spectrum has the correct harmonic profile, though the idealised version will exhibit higher harmonic levels as the frequency approaches half the sample rate than a sawtooth waveform should. The actual frequency that has been generated is shown at the top right corner of the frequency display when the generator is running, at higher frequencies this can be significantly different to the frequency that was entered. Dither should be applied to avoid artefacts due to quantisation.
The option to Band limit sawtooth samples generates the data by
summing the constituent harmonics of the signal up to half the sample rate. This avoids
out-of band content in the raw data and produces correct harmonic levels throughout the bandwidth.
The frequency constraint for band limited data is much less strict, but for efficient signal
generation the exact frequency used will chosen so that the data values repeat within at most 8192
samples. The frequency used will usually be within 0.1% of the requested frequency, but the minimum
frequency is 5.4 Hz at 44.1 kHz sample rate and proportionately higher at higher sample rates.
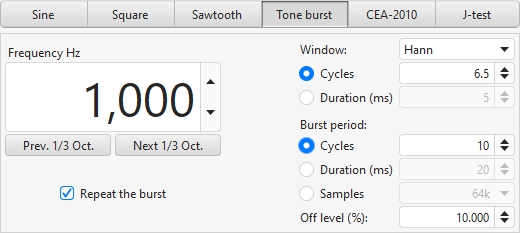
The Tone Burst generator produces a windowed tone burst of the selected number
of cycles at the selected frequency.
If the Repeat the burst checkbox is selected the burst will be repeated at the selected period. The period may be specified in cycles, ms or as a number of samples. If the period is in cycles the tone can contain at the "Off level" between bursts. Using a number of samples equal to the RTA FFT length allows a stable display of the signal spectrum if a Rectangular RTA window is used. The Previous 1/3rd octave frequency and Next 1/3rd octave frequency move the generator to a 1/3rd octave centre frequency.
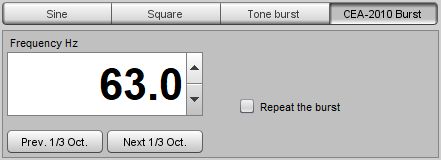
The CEA-2010 Burst generator produces a 6.5 cycle, Hann-windowed tone burst
at the selected frequency. This signal is used for testing the maximum power
output of subwoofers by using an RTA in Spectrum mode to observe the levels of
the distortion components produced when the signal is playing, usually testing
at 63, 50, 40, 31.5, 25 and 20 Hz. The signal is also used when testing maximum
SPL of loudspeakers under CTA-2034-A, at 1/3 octave centre frequencies over the
range from 20 Hz to 5 kHz. The CEA-2010 limits for the distortion components
are per ANSI/CTA-2010-B R-2020.
If the Repeat the burst checkbox is selected the burst will be repeated at intervals of not less than 1 second (the actual interval is chosen to align with the RTA block length). The Prev. 1/3 Oct. and Next 1/3 Oct. buttons move the generator to a one-third octave centre frequency.
The highest level of the fundamental for which none of the harmonic limits are exceeded
is the maximum output level at that test frequency. The reference level for the limits
is the maximum level within the 1/3 octave span of the test frequency. When the CEA burst signal is playing
the RTA shows the limits and the peak level at the test frequency as an overlay, provided
the RTA is in Spectrum mode. The peak level is shown in red if the limits are exceeded.
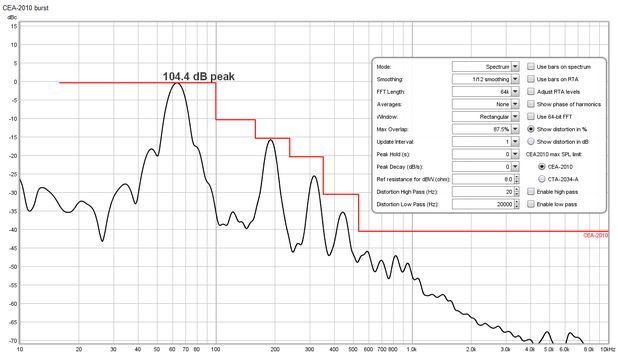
If the RTA data from a CEA-2010 signal is saved as a measurement the peak level and limits overlay will be shown on the SPL & Phase graph and the CEA-2010 test frequency and peak level figure will be recorded in the measurement notes.
The recommended RTA settings for 44.1 kHz or 48 kHz sample rate are:
For 88.2 kHz or 96 kHz use FFT length of 128k (131,072). Refer to the ANSI/CTA-2010-B R-2020 or ANSI/CTA-2034-A standards for details of the measurement procedure, or search for guides on the Internet.
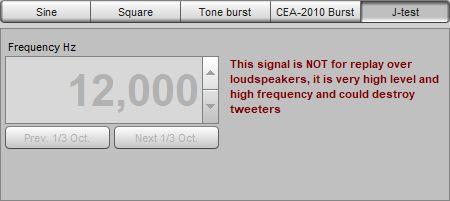
The jitter test signal consists of a square wave at one quarter of the sample rate at half full scale amplitude modulated by a square wave at 1/192 of the sample rate that alternates between 0 and -1 lsb at the 24-bit level. This signal is NOT for replay over loudspeakers, it is very high level and high frequency and could destroy tweeters. Analysing the signal on Windows requires use of the WASAPI exclusive device entries with Java drivers or using an ASIO driver.
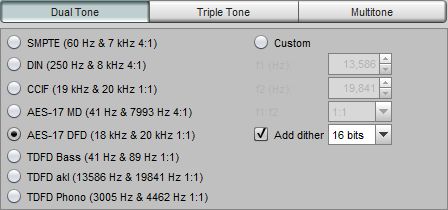
The dual tone generator is to facilitate intermodulation distortion measurements. It has presets for AES17-2015, SMPTE, DIN, CCIF and TDFD signals and allows custom signals to be generated with ratios of 1:1 or 4:1. Note that for valid IMD results with custom signals f2 must be higher than f1. The rms level of the combined signal is the signal generator rms level, but dual tone signals have a higher crest factor than a single tone so the signal will clip at a level 3 dB lower than a sine wave for 1:1 signals (crest factor 6 dB) or 1.7 dB lower for a 4:1 signal (crest factor 4.7 dB).
When the dual tone signal is being used the RTA can show figures for the intermodulation distortion and the levels of the various intermodulation components.
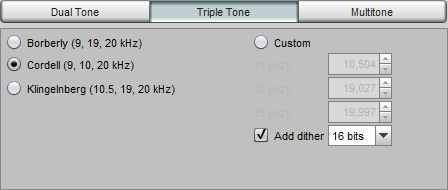
The triple tone generator provides an additional stimulus for intermodulation distortion
measurements. It has presets for versions according to Borberly, Cordell and Klingelnberg
and allows custom signals to be generated. All tones have the same level. The rms level of
the combined signal is the signal generator rms level, but triple tone signals have a higher
crest factor than a single tone so the signal will clip at a level 4.8 dB lower than a sine wave
(crest factor 7.8 dB). For a discussion of these signals see Klingelnberg, Arndt: Non-linear
distortion revisited, 29th Tonmeistertagung, VDT International Convention, November 2016. The
exact frequencies of the signals are:
| Signal | f1 | f2 | f3 |
|---|---|---|---|
| Borberly | 9000 | 19030 | 20000 Hz |
| Cordell | 9000 | 10050 | 20000 Hz |
| Klingelnberg | 10504 | 19027 | 19997 Hz |
When the triple tone signal is being used the RTA can show figures for the Total Distortion + Noise (TD+N) percentage.
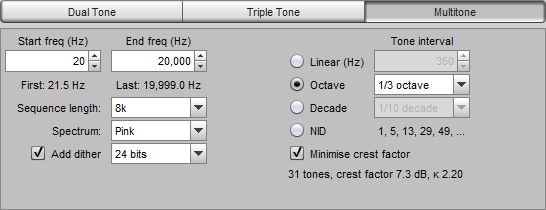
The multitone generator produces multiple tones over a defined frequency span. The tones can be spaced linearly, logarithmically at a selected fractional octave or fractional decade interval or in a sequence that places the tones such that they do not correspond to the low order harmonic or intermodulation products of other tones ('No Interharmonic Distortion' or NID). Octave fraction spacing uses frequencies from the preferred list. In all cases the tones are placed at the bin centres of an FFT of the selected sequence length, so that the behaviour of a system fed by the tones can be observed on an FFT with at least that length using a rectangular window.
If the option to minimise crest factor is selected the phases of the tones in the multitone sequences will be adjusted to minimise the crest factor of the signal. For linearly spaced tones that will typically produce sequences with crest factors below 5 dB. Log spaced and NID tones may have crest factors of 12 dB or more, minimisation has little if any effect on those. The crest factor and kurtosis κ of the signal are shown on the panel. Note that this is the crest factor of the signal as generated, the crest factor may increase during D to A conversion. The maximum RMS level before clipping is 3 minus the crest factor, e.g. -6 dBFS for a 9 dB crest factor (with the View option Full scale sine rms is 0 dBFS selected, 3 dB lower otherwise) but a lower setting may be required to avoid clipping on the receiving device.
The multitone sequence can be configured to have a white (equal amplitude) or pink (amplitude falling at 10 dB/decade) spectrum. Pink spectrum sequences will typically have lower crest factors (if minimised) and are recommended for testing speakers. White spectrum is the norm for testing electronic devices, it has much more energy at high frequencies than pink noise and is not recommended for use with speakers, it may damage tweeters at high levels.
When the multitone signal is being used the RTA can show a figure for the Total Distortion + Noise (TD+N) percentage and, if the FFT is two or more times the signal length, a signal to noise ratio (SNR) figure.
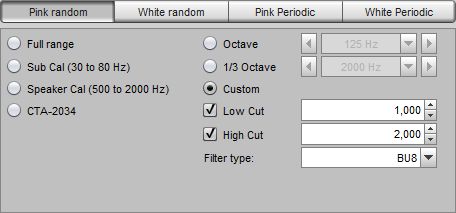
The Pink Noise generator uses white noise filtered through a -10 dB/decade filter generated from a weighted sum of a series of first order filters, as devised by Paul Kellet circa 1999. Stated accuracy is within 0.05 dB above 9.2 Hz at 44.1 kHz sample rate.
The Full Range option outputs the filtered noise directly, giving the widest bandwidth and the greatest low frequency content. The Speaker Cal option applies 2nd order (40 dB/decade, 12 dB/octave) filters at 500 Hz and 2 kHz, producing a signal with its energy centred on 1 kHz. Sub Cal applies filters at 30 Hz and 80 Hz. Both are broadly in line with the THX test signal recommendations. CTA-2034 filtering applies shaping in accordance with ANSI/CEA-2034-A Standard Method of Measurement for In-Home Loudspeakers. The octave and 1/3 octave options filter the signal at the selected centre frequency with 1 octave or 1/3 octave total bandwidth. Custom Filtered allows low and/or high cut filter frequencies to be set arbitrarily, subject to a minimum bandwidth of 1/3 octave. The filters are Butterworth high pass and low pass with a choice of filter order from 2nd (12 dB/octave) to 8th (48 dB/octave).
REW automatically adjusts the signal levels for the various options and filter settings so that the signal RMS value reflects the setting in RMS Level. Note that as Pink Noise has random variations some clipping of peaks will occur at RMS levels above approximately -12 dBFS (or -9 dBFS if 0 dBFS is configured in the View preferences to be the level of a full scale sine).
White noise has much more energy at high frequencies than pink noise and is not recommended for use with speakers, it may damage tweeters at high levels.
Periodic Noise (PN) sequences are ideally suited for use with spectrum and
real time analysers (RTA's). They contain every frequency the analyser can
resolve in a sequence length that matches the length of the analyser's FFT.
Their great benefit is that they can produce the desired spectrum shape without
requiring any averaging or windowing (when the input and output are on the same device and so share the same clock).
That means the analyser display reacts much more rapidly to changes in the system than it would
if testing with pink or white random noise, making PN ideal for live adjustment of EQ filters.
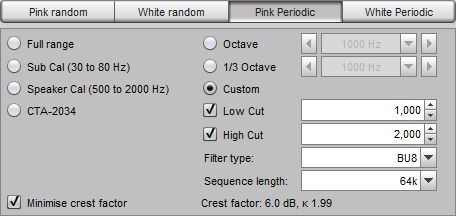
The PN sequences REW generates may optionally be optimised to have a crest factor (ratio
of peak level to rms level) that does not exceed 6 dB for full range sequences,
narrower sequences should have crest factors less than 6.5 dB. Crest factor is
around 12 dB without minimisation. The crest factor and kurtosis κ of the signal
are shown on the panel. The CTA-2034 filtered noise has a crest factor of 12 dB,
per the specification, minimising the crest factor is not an option for that signal.
Use Pink PN when measuring with an RTA or White PN with a Spectrum analyser.
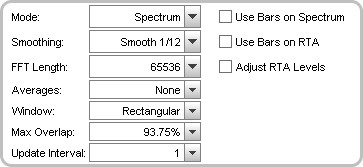
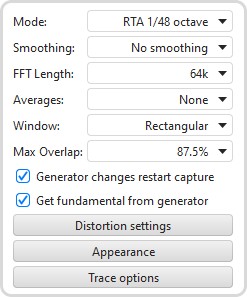
The Sequence Length control must be set the same as the length of the FFT used by the analyser. If it is shorter than the analyser FFT there will be notches in the analyser display, as the periodic noise will not contain some of the frequencies the analyser is looking for. If it is set longer the extra frequencies will give a noisy display requiring more averaging. When using the REW RTA the sequence length is automatically set the same as the FFT length. Here are example RTA settings for a 64k FFT length for use when the input and output are on the same device and so share the same clock:
Here are example RTA settings for a 64k FFT length for use when the input and output are on different devices. Windowing and specific averaging and overlap settings are required to counter the effects of any clock rate difference:
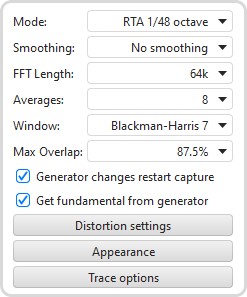
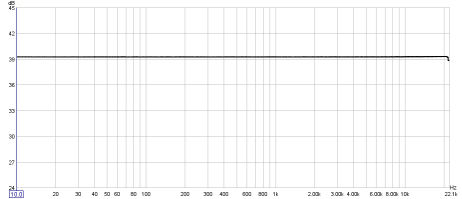
The images below show the effect of correct and incorrect settings of the PN
length for a loopback measurement with 1/48 octave RTA that is using an FFT
length of 65536 (64k).
Length 32768, shorter than FFT
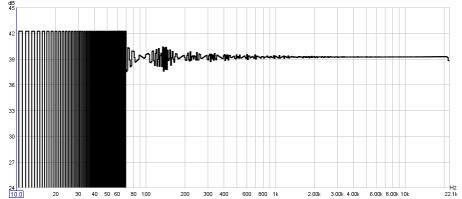
Length 131072, longer than FFT (no averaging)
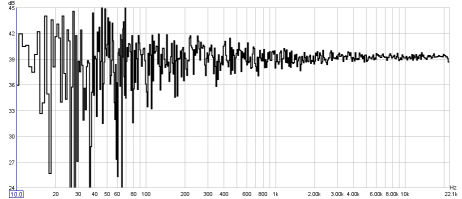
Length 65536, matching FFT
The Full Range option generates noise over a span from the lowest frequency for the selected FFT length to half the sample rate, giving the widest bandwidth and the greatest low frequency content. Pink full range has a flat spectrum below 10 Hz (like the pink random noise) to avoid excessive energy at the very lowest frequencies. The Speaker Calibration option generates noise from 500 Hz to 2 kHz, producing a signal with its energy centred on 1 kHz. Subwoofer Calibration generates noise from 30 Hz to 80 Hz. CTA-2034 filtering applies shaping in accordance with ANSI/CEA-2034-A Standard Method of Measurement for In-Home Loudspeakers and has a 12 dB crest factor. The octave and 1/3 octave options filter the signal at the selected centre frequency with 1 octave or 1/3 octave total bandwidth. Custom Filtered allows low and/or high cut frequencies to be set arbitrarily, subject to a minimum bandwidth of 10%. The Sub cal and Spkr cal signals are brick wall filtered. Other filtered signals offer choice of Butterworth high pass and low pass with filter order from 2nd (12 dB/octave) to 8th (48 dB/octave) or brickwall.
REW automatically adjusts the signal levels for the various options and filter settings so that the RMS values reflect the setting in RMS Level. Clipping of peaks will occur at RMS levels of -6 dBFS or above.
The Pink PN sequence can be saved to a wave file and used to generate
a test file or disc to be played on a system whose response is to be measured.
Make sure that the selected sample rate corresponds with the format of the disc
to be made - for example, 44.1kHz should be used if generating a CD, or 48kHz
for a DVD. When measuring the system the sample rate and FFT length must be
the same as used for the test file or disc.
White noise has much more energy at high frequencies than pink noise and is not recommended for use with speakers, it may damage tweeters at high levels.
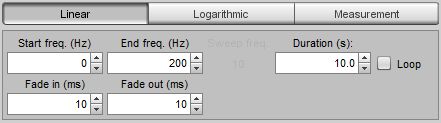
The Signal Generator can produce sweeps with configurable start frequency,
end frequency, duration and linear or logarithmic progression. Sweep duration
can be up to 60 seconds. If the "Loop" box is checked the sweep will repeat
continuously. The sweeps have a configurable raised cosine fade in and fade
out (which can be set to zero for no fade). When a sweep is playing the current
sweep frequency is shown on the panel.
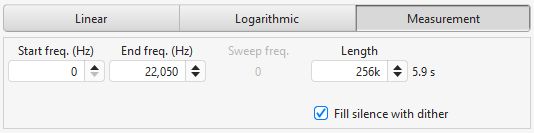
The Measurement Sweep signal is used by REW when measuring system response.
It consists of a logarithmic sweep from half the start frequency to twice the
end frequency (with an overall limit of half the interface sample rate) to provide
accurate measurement over the selected range. If the start frequency is below 20Hz
the signal begins with a linear sweep from DC to 10Hz, followed by a logarithmic sweep
from there to the end frequency. The sweep duration is set using the Length control.
This signal is selected automatically to make sweep measurements. Measurement sweeps
can be saved to WAV files to use for offline measurement.
Note that the measurement sweep may change between REW versions so always use a sweep
generated with the REW version being used for analysis of the captured response.
If Play dither before sweep is selected the generator will play a short period of dithered silence before the sweep starts. This option is provided to ensure the replay chain is active before the sweep signal starts.
If Fill silence with dither is selected the generator will replace silent parts of the sweep with 16-bit dither. This option is provided to try and counter aggressive output muting which some DACs exhibit when one of their input channels does not have any signal. There is some penalty in the impulse response noise level, though it is far below the noise floor for acoustic measurements, only potentially having an impact when measuring electronics. Nonetheless the option should only be selected if required to counter device behaviour.