
REW is a software package that measures the transfer functions of acoustic systems and displays the corresponding frequency, phase and impulse responses and various quantities derived from them. If that sentence made you ask yourself what on earth is he talking about? It would be worth taking a few minutes to read through the introduction to Signals and Measurements, which explains the basic concepts. Even if you are already familiar with the terminology a quick browse through that introduction may be helpful.
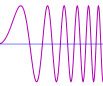
REW uses a logarithmic sine sweep method and a basic explanation follows. If you'd rather not know, you can skip the explanation.
You can find out a great deal about the log sweep method, and the various alternatives, by reading the paper "Transfer-Function Measurement with Sweeps" by SWEN MÜLLER and PAULO MASSARANI
| To make a measurement we need a sound source (a loudspeaker or subwoofer) and a microphone (SPL meters contain a microphone and many can be used instead of a mic). A logarithmic sweep signal is sent to the source, starting low and steadily increasing to a higher frequency. A logarithmic sweep is one that takes the same time to double in frequency. It takes the same time to go from 40 to 80Hz or 4kHz to 8kHz as from 20 to 40Hz. The mic picks up the sweep, sensing the sound that travels directly from the source and all the sound that first bounces off the room surfaces. Some sound paths may bounce off several room surfaces before reaching the microphone. |
|
|
|
Once the sweep completes, analysis starts. A process called "Fast Fourier Transform" (FFT) is used to calculate the phase and amplitude of the frequency spectrum that made up the sweep. By comparing the amplitudes and phases of the spectrum of the received microphone signal with those sent in the sweep we can work out how each frequency has been affected by the loudspeaker and room we are measuring. This is called the "Transfer Function" of the room from the location of the source to the location of the mic. Note: A different source position or different mic position will have a different transfer function. In other words, our measurement is only valid for one specific source and mic position. Having worked out the transfer function we can use an "inverse FFT" to get from the frequency amplitude and phase information to a time signal that describes the way any signal is changed when travelling from the source to the mic. That time signal is called the "impulse response" - like the transfer function it is derived from, it is only valid for one specific source and mic position.
| The impulse response is actually exactly the same signal we would see if we could emit a very short but loud click at the source position and record what the mic picks up afterwards ("very short" meaning lasting just the time of 1 sample at the sample rate we are using for our analysis, so for a 48 kHz sample rate that would be just 1/48,000 of a second which is 21 millionths of a second). You might ask why we don't just use a click then. One difficulty is that the click, because it is so short, needs to be extremely loud for us to be able to pick up what happens after the initial click over the background noise of the room. We could no longer use a speaker to generate that, we would need something like a starting pistol or to pop a balloon. We would also need a mic that could cope with both the extremely loud click itself and the much quieter echoes of the click produced by the room. You are likely to find that your family and neighbours are not that keen on you repeatedly firing a pistol to figure out what your room is doing, and even if they put up with it your results would not be as good as using a sweep. To be technical about it, you can achieve a much higher signal-to-noise (S/N) ratio by the sweep method. The S/N is determined by the background noise level and by how much energy is in the test signal, which in turn depends on how loud the signal is and how long it lasts. An impulse is extremely short, a few millionths of a second, so to get any significant energy it needs to be extremely loud. A sweep can last for many seconds, so even at a modest volume its total energy can approach as much as a million times more than an impulse. | 
|
Once the impulse response has been obtained, it can be analysed to calculate information about how the room behaves. The simplest analysis is the FFT, to show the frequency response between the source and mic positions. However, we have some control over it. Altering which part of the impulse response is analysed by the FFT changes what aspect of the room's response we see. The early part of the impulse response corresponds to the direct sound from the source to the mic, the shortest path between them. Sound that has bounced off the room's surfaces has to travel further to reach the mic, which takes longer, so the later parts of the impulse response contain the contributions of the room. "Windowing" the impulse response to look at only the initial part shows us the frequency response of the direct sound with little or no contribution from the room. A window that includes later parts of the response lets us see how the room's contribution alters the frequency response. The ability to separate the contributions of the direct and later (reflected) sound is a key difference between the frequency response derived from an impulse response and one from a Real Time Analysis (RTA), which can only show the total combined response of source and room.
Other information we can get from the impulse response include a "waterfall" plot,
which is generated by moving a window in steps along the response and plotting the various
frequency responses in order to produce a 3D picture of the way the response changes over
time, and the room's "RT60" data, which is the time it takes sound in various frequency bands
to decay by 60dB (or 1,000 times smaller than the original level).

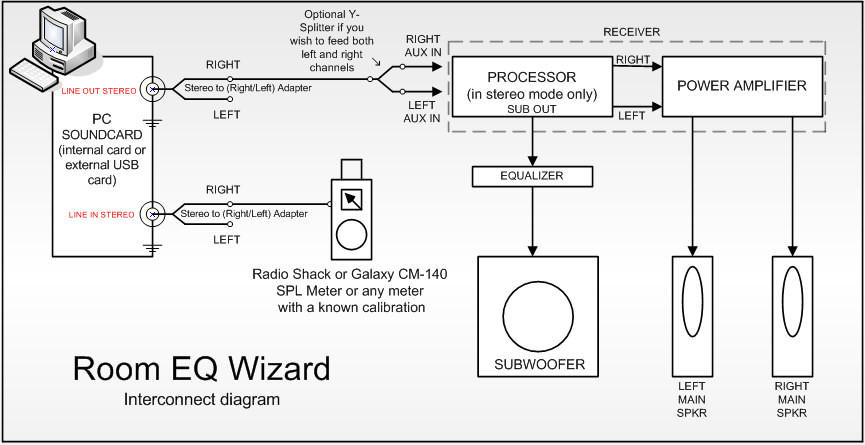
The overall setup for measuring when using an SPL meter is shown below. If you are
using a USB microphone you do not need to make any connections to the interface inputs,
just connect the mic to a USB port on your computer.
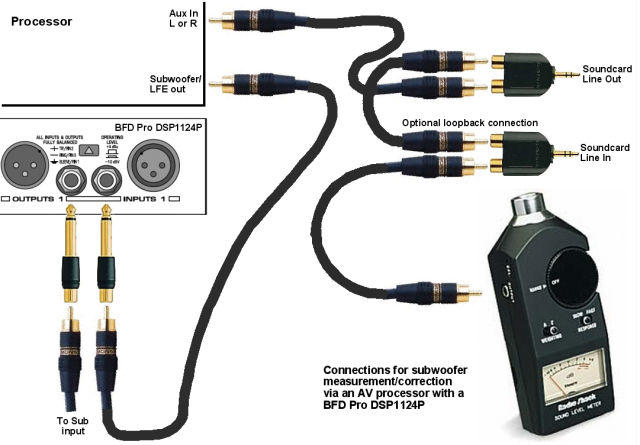
If using an equaliser(such as BFD Pro DSP1124P or FBQ2496) to optimise
your subwoofer's response it should be connected between your AV processor's
LFE/Sub output and the subwoofer's low level input. For a BFD Pro the
operating level switches on the rear panel should be pressed in to select
the -10 dBV range.
If the AV processor input being used has an anti-clipping feature (automatically reducing its sensitivity if it detects large signals) this should be turned off, as it could shift the measurement levels. The sensitivity of the input should ideally be set to 0.5V, though this is not critical.
The TAG McLaren AV32R DP and AV192R allow the test signal input to be routed to any speaker output via the Test Signal entry within the TMREQ filter menus for each speaker, which is handy for measuring other speakers (see this note for details). They seem to be the only AV processors with such a facility, other processors may have 5.1 or 7.1 analog inputs that can be used to similar effect, but in some cases bass management will not be applied to such inputs, limiting the ability to check sub/main speaker integration.
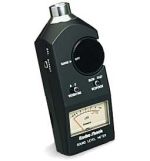
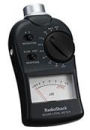
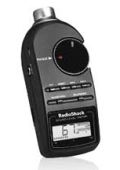
If you are using an SPL meter as the input the meter's range should be set to the value normally used for speaker level calibration and must not be altered while using REW. If you are using the Radio Shack meter, select the 80dB range if you calibrate your system at 75dB (this is the standard level recommended by DolbyTM). Set your meter to C weighting and "slow". Select the Input device is a C weighted SPL meter option in Preferences -> Cal Files.
Having assembled the equipment required we can look it how REW itself is organised for making and analysing measurements in the REW Overview.